Battery Status Monitoring
We all know that BMS stands for Battery Management System. To perform its role effectively, it is essential for BMS to monitor the battery status. Voltage, current, and temperature are all key parameters to monitor. If these parameters become abnormal, the battery will be at risk. While impacts on battery performance and lifespan are already minor issues, it can even lead to hazards like explosions, which are extremely dangerous. Therefore, ensuring accurate monitoring of voltage, current, temperature, and other quantities is a key consideration in BMS design.
Voltage Monitoring
Each individual battery can affect the performance of the entire battery pack. Even if most individual batteries are in good condition, the battery pack will be affected if just one is faulty. Voltage is a crucial parameter that reflects the operating status of the battery. When the battery discharges, the active materials on the positive and negative electrodes are continuously consumed, the potential difference gradually decreases, and the voltage also drops steadily. Through voltage, you can quickly estimate the remaining charge.
A healthy battery has a stable voltage curve: the voltage drops slowly during discharge and rises steadily during charging. In contrast, an aged or damaged battery (e.g., with electrode crystallization or electrolyte drying) will exhibit voltage abnormalities, such as a sudden voltage drop during discharge or reaching the voltage upper limit early during charging.
Voltage abnormality is also an early sign of battery failure. For example, the voltage will drop to nearly 0V instantly in case of a short circuit, and exceed the safety upper limit when overcharged. By now, you should understand that monitoring voltage allows us to determine the battery’s remaining charge and health status, issue early warnings, and prevent safety accidents such as fire and swelling.
GB/T 38661-2020 (Technical Specifications for Battery Management Systems in Electric Vehicles) specifies clear requirements for voltage detection accuracy:
- For lithium-ion power batteries, the voltage detection accuracy for individual cells (cell groups) shall meet ±0.5% Full Scale (FS), and the absolute value of the maximum error shall not exceed 10 mV.
- For nickel-hydrogen power batteries, the voltage detection accuracy for individual cells (cell groups) or modules shall meet ±1% FS.
Compliance with various standards is also a must if you intend to market BMS products. If you are looking to purchase a BMS, be sure to check whether it has obtained standard certifications to avoid being scammed by unethical merchants.
So, how does BMS monitor the voltage of individual batteries? The answer lies in a key contributor to the rapid development of the electronic world: chips. BMS uses dedicated battery voltage monitoring chips for collection and measurement, known as Analog Front End (AFE) chips. Major manufacturers in the market currently include ADI, ST, TI, and NXP. Due to space limitations, only one sampling circuit – the ADI LTC6811 – will be introduced here.
The LTC6811 is a multi-channel battery monitoring chip, which can be used to collect the individual voltages of series-connected battery packs (e.g., in electric vehicles and energy storage systems).
Battery voltage changes slowly, and high-frequency noise can interfere with ADC sampling. To ensure a clean signal, an RC filter circuit (100Ω resistor + 10nF capacitor) is used. The cut-off frequency is calculated as fc = 1/(2πRC) ≈ 1/(2π×100Ω×10nF) ≈ 159kHz. This circuit only allows the passage of battery voltage (a slowly changing DC signal) and blocks high-frequency interference. Low-pass filtering is used to eliminate high-frequency noise (e.g., PWM switching noise, electromagnetic radiation).
The function of the P-channel MOSFET (BSS308PE) + 3.3kΩ resistor in the diagram is as follows: The MOSFET acts as a controllable switch, controlled by the S1/S2 pins of the LTC6811. When S1 outputs a low level, the P-channel MOSFET turns on (gate voltage < source voltage), and the battery voltage is connected to the chip. When S1 outputs a high level, the MOSFET turns off, disconnecting the battery from the chip. The 3.3kΩ resistor is a gate current-limiting resistor, which prevents damage to the MOSFET gate due to instantaneous large currents and controls the switching speed (since battery sampling has low speed requirements, the resistance can be appropriately increased). The 33Ω resistor is used for series current limiting to prevent damage to the chip or MOSFET caused by instantaneous large currents (battery short circuit, surge) when the MOSFET is on.
The C0/C1/C2 interfaces of the LTC6811 chip are differential sampling inputs, used to measure the voltage difference between adjacent batteries (e.g., CELL1 voltage = C1 – C0, CELL2 voltage = C2 – C1). Differential sampling measures the voltage difference between two points and can suppress common-mode noise compared to single-ended sampling. S1/S2 are control pins, which control the on/off of the MOSFET through high and low levels to achieve on-demand sampling. V- is the reference ground, connected to the negative electrode of the battery, and serves as the reference for voltage sampling.
The entire circuit works as follows: The analog voltage signals output by each battery (e.g., CELL1, CELL2) in the series-connected battery pack are processed by the peripheral circuit. Then, the ADC inside the AFE chip converts these analog signals into digital signals. Finally, the digital signals are transmitted to the Microcontroller Unit (MCU) to calculate the State of Charge (SOC) and State of Health (SOH), and trigger functions such as balancing and protection.
Current Monitoring
Since voltage has been mentioned, current – which we learned in junior high school is inseparable from voltage – must also be covered. Current monitoring is the first line of defense for protecting the battery in case of short circuits and overcurrent faults. Only one total current needs to be monitored for a battery pack, but the monitoring frequency is relatively high.
GB/T 38661-2020 also sets requirements for current detection accuracy:
- For lithium-ion power batteries, the total current detection accuracy shall meet ±2% FS.
2. For nickel-hydrogen power batteries, the total current detection accuracy shall meet ±3% FS.
Shunt Resistor
Current can be collected using a shunt resistor. This solution is a basic option with high accuracy and low cost, and is widely used. When the battery charges or discharges, the current I flows through the resistance R of the shunt resistor. According to Ohm’s Law (V=IR), a small voltage drop is generated (usually 10mV~100mV). For example, when a 500A current flows through a 0.1mΩ shunt resistor, the voltage drop = 500A × 0.0001Ω = 50mV.
The magnitude and direction of this voltage drop directly correspond to the magnitude (higher voltage indicates larger current) and direction (current reverses during charging, and the voltage polarity also reverses) of the current.
The mV-level voltage is too weak, so a differential amplifier (e.g., TI INA282) is needed to amplify the voltage to 1V~5V (to match the ADC input range) while suppressing common-mode noise (e.g., interference voltage in the main circuit). Then, an ADC is used to convert the amplified analog voltage signal into a digital signal that the MCU can recognize. It is recommended to choose a 16~18-bit Δ-Σ ADC (e.g., TI ADS8910B, ADI AD7799), which features low noise (<1μV) and good linearity (±0.001%). With a 10A range, its resolution can reach 38μA, meeting the high-precision requirements for SOC estimation.
The MCU reads the digital quantity output by the ADC, and combines it with the calibrated resistance value R of the shunt resistor. It then calculates the actual current using the formula I=V/R. For example, if the digital quantity corresponds to a voltage of 30mV and the shunt resistor resistance is 0.1mΩ, the current = 30mV / 0.1mΩ = 300A.
Hall Sensor
Another method is to use a Hall sensor, which is suitable for high-voltage scenarios and requires electrical isolation. This method is based on a classic principle – the Hall effect (a concept you must have heard of even if you only studied basic junior high school physics).
When the battery current I flows through, a magnetic field B is generated around the copper bar according to Ampère’s right-hand rule. The magnetic field strength is proportional to the current magnitude. The Hall element inside the sensor generates a Hall voltage VH = KH×B×IH in this magnetic field, where KH is the Hall coefficient and IH is the operating current of the Hall element.
A dedicated amplifier circuit amplifies the weak Hall voltage to 1V~3V, which serves as an error signal. The amplified error signal drives the feedback coil to generate a reverse magnetic field Bf. This magnetic field offsets the original magnetic field B generated by the copper bar current until the total magnetic field in the magnetic core reaches a near zero-flux state.
At this point, the current If of the feedback coil is proportional to the original current I (If = K×I, where K is the proportional coefficient). A resistor Rf is connected in series with the feedback coil. When the current If flows through it, a voltage Vf = If×Rf is generated, which is more stable and has better linearity.
Next, you need to use an ADC to convert Vf into a digital signal and transmit it to the MCU. The MCU calculates the original current using the formula I = Vf/(K×Rf) based on the proportional coefficient K of the feedback coil and the sampling resistor Rf. For example, if Vf = 2V, K = 0.1, and Rf = 10Ω, then I = 2/(0.1×10) = 200A.
Fluxgate Sensor
We have discussed the method of “electricity generating magnetism”; next is “magnetism generating electricity” – the fluxgate sensor.
First, you need to pass an alternating square-wave current through the excitation coil. The current direction reverses periodically, causing the soft magnetic core to cycle between “positive saturation → demagnetization → negative saturation → demagnetization”. When the magnetic core is saturated, its magnetic permeability drops sharply; when demagnetized, the magnetic permeability is restored. This process causes the detection coil to induce a symmetric AC voltage.
When the battery current I flows through the copper bar, the generated static magnetic field B is superimposed on the magnetic field of the excitation coil. After superposition, the magnetic core reaches saturation faster in the positive half-cycle and slower in the negative half-cycle (due to the offset of the superimposed magnetic field). This makes the AC voltage induced by the detection coil no longer symmetric – the voltage peak in the positive half-cycle becomes smaller/larger, while the peak in the negative half-cycle becomes larger/smaller. The degree of asymmetry is proportional to the measured current I.
However, the asymmetric AC voltage output by the detection coil contains signals of the excitation frequency (interference) and “DC/low-frequency signals” related to the measured current (useful signals). Therefore, a demodulation circuit (e.g., a synchronous detector) is needed to filter out the interference of the excitation frequency and extract the DC voltage signal Vout proportional to the current I.
Next, similar to the two methods mentioned above (which you are probably tired of seeing by now), ADC conversion and MCU calculation are required. A 16-bit or higher ADC is used to convert Vout into a digital signal, which is then transmitted to the MCU. Based on the sensor’s calibration coefficient (the pre-calibrated voltage-current correspondence), the MCU directly converts the digital signal into the actual current I.
Temperature Monitoring
Have you noticed that overheating is a very common issue for all battery-powered devices, whether it’s a mobile phone or a computer? Sometimes, when taking photos with a mobile phone outdoors in summer, the phone gets extremely hot within a short time, and you have to turn it off to cool it down.
Eighty percent of battery fire accidents worldwide are related to BMS protection failure. By now, you should be aware of the importance of monitoring battery temperature. Due to the widespread recognition of its importance, GB/T 38661-2020 also sets requirements for temperature detection accuracy:
- For lithium-ion power batteries, the temperature detection accuracy shall meet ±2℃ within the range of -20℃~65℃, and ±3℃ within the ranges of -40℃~-20℃ and 65℃~125℃ (or the maximum measured temperature calibrated by the BMS).
- For nickel-hydrogen power batteries, the temperature detection accuracy shall meet ±3℃ within the range of -20℃~65℃, and ±5℃ within the ranges of -40℃~-20℃ and 65℃~125℃ (or the maximum measured temperature calibrated by the BMS).
Temperature can be measured using temperature sensors, with common types including NTC thermistors and digital temperature sensors (e.g., MAX31865). At least two sensors should be placed on the surface of each module in the battery cell, covering the highest temperature areas (center, connections) and the lowest temperature areas (edges). Additional sensors should be installed in heat-prone areas such as the battery cell poles, bus bars, and cold plate contact surfaces.
Here’s a classic story: When designing fighter jets during wartime, emphasis was placed on protecting the parts of the jets that returned to base without severe damage. This is because only by protecting these key areas can the utilization rate of the fighter jets be improved. Similarly, additional monitoring and protection should be applied to the heat-prone areas of the battery.
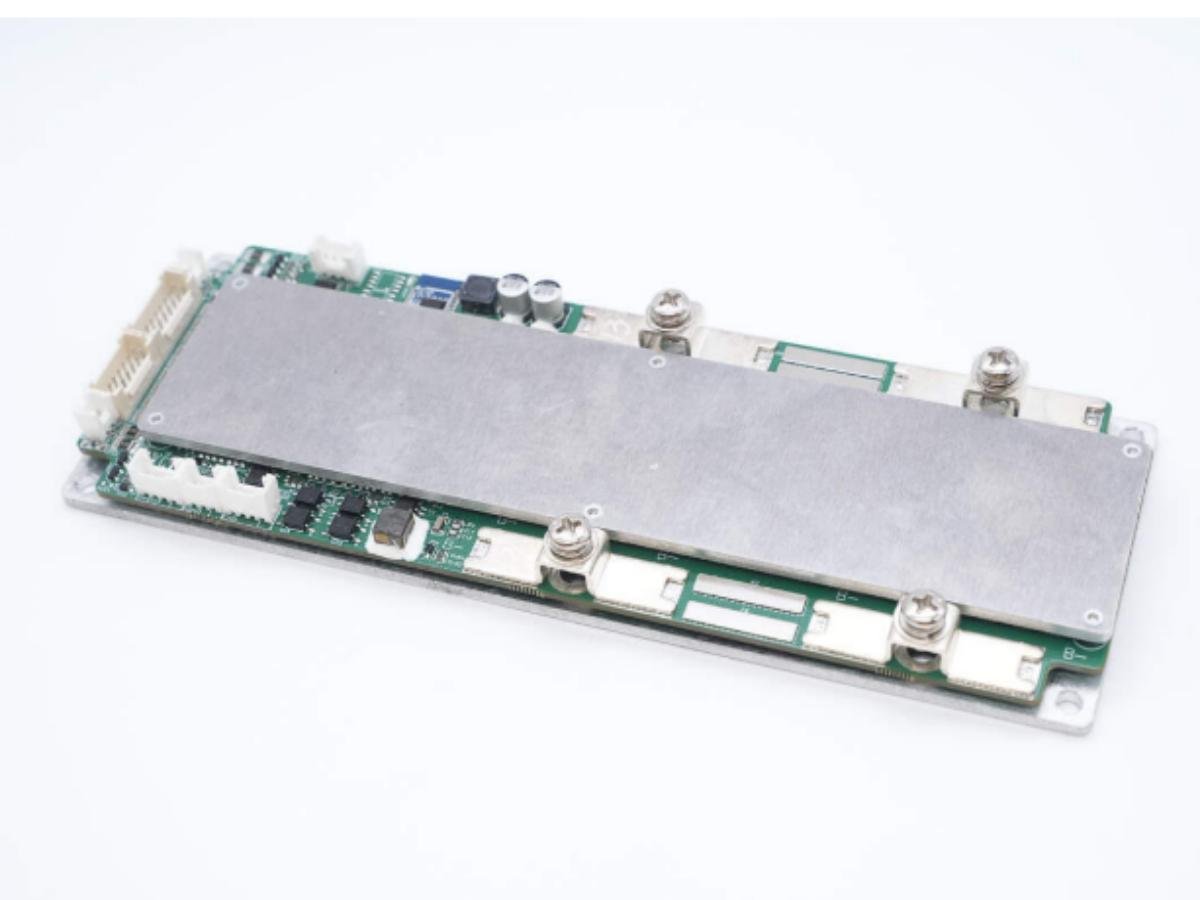
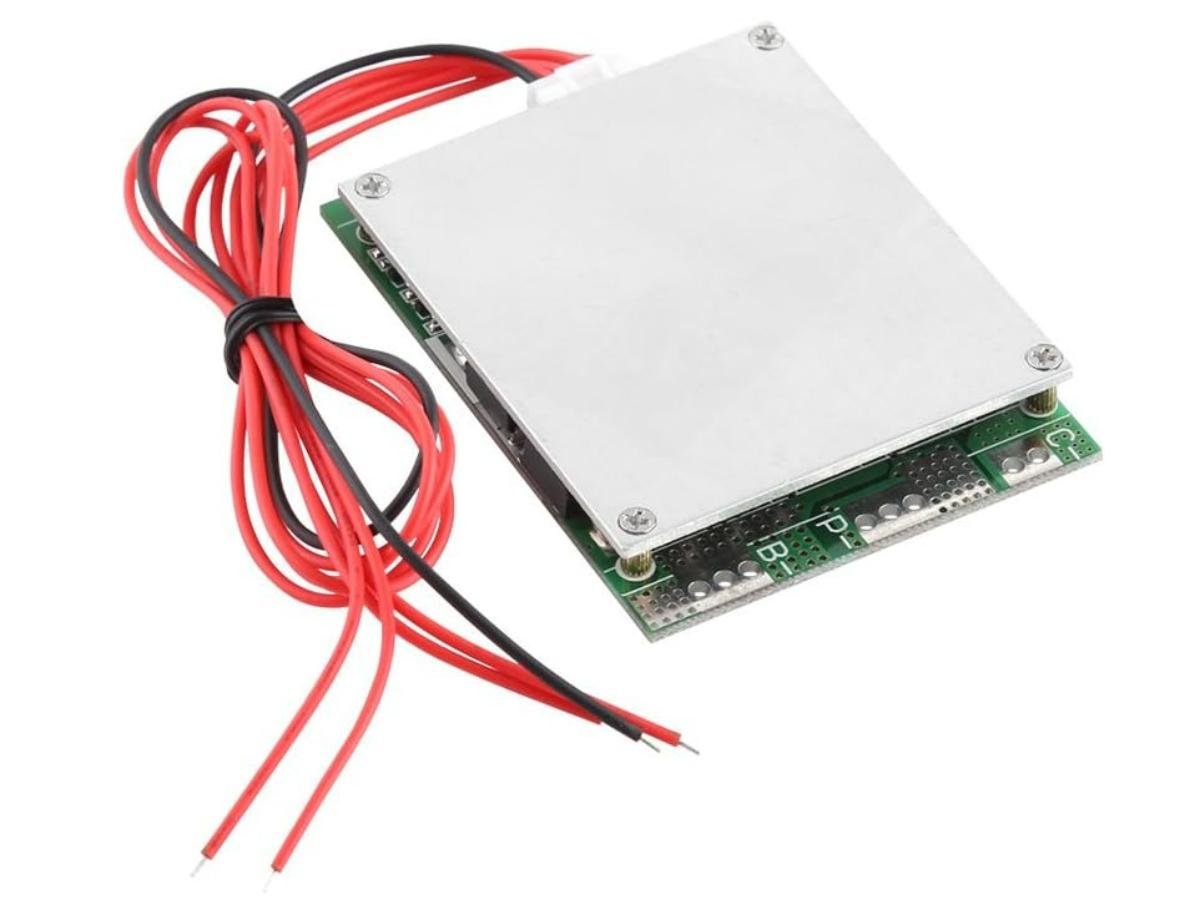
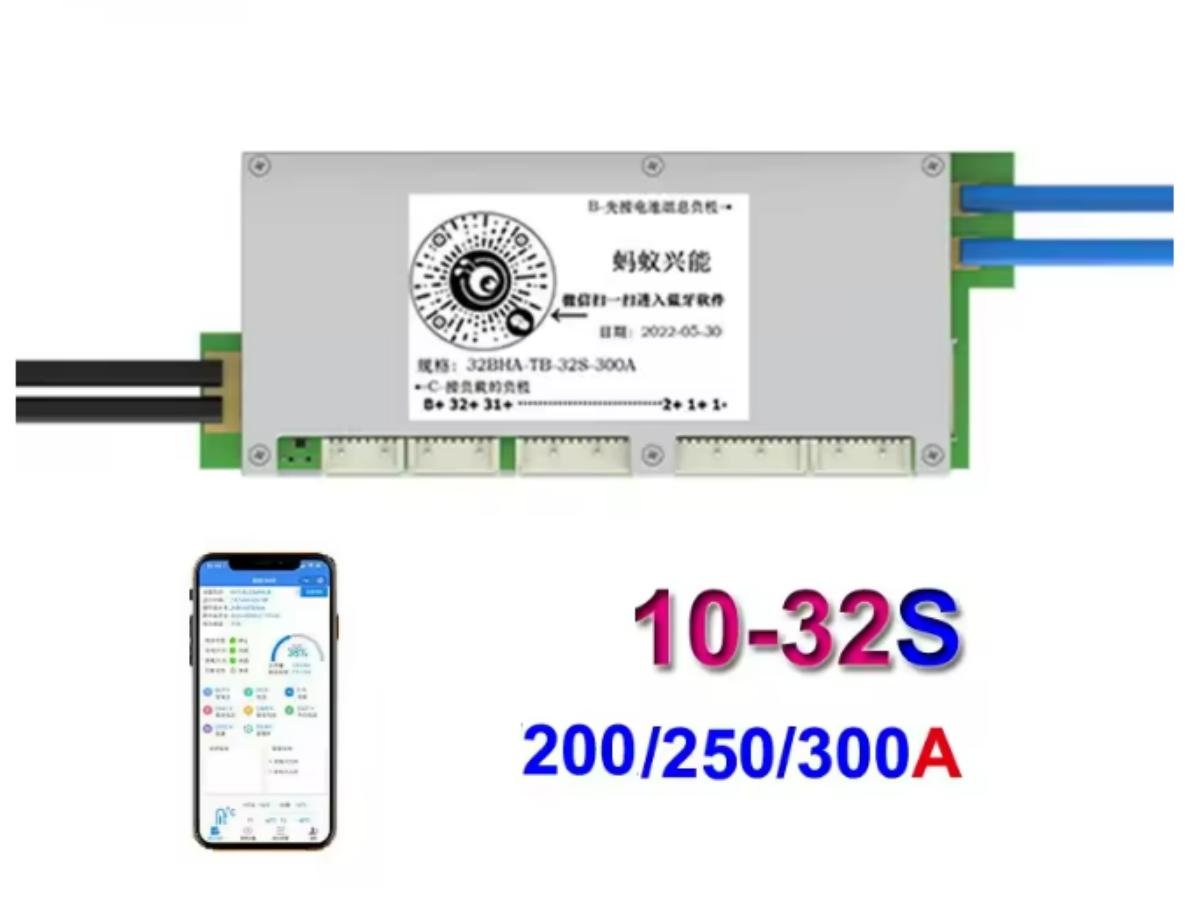
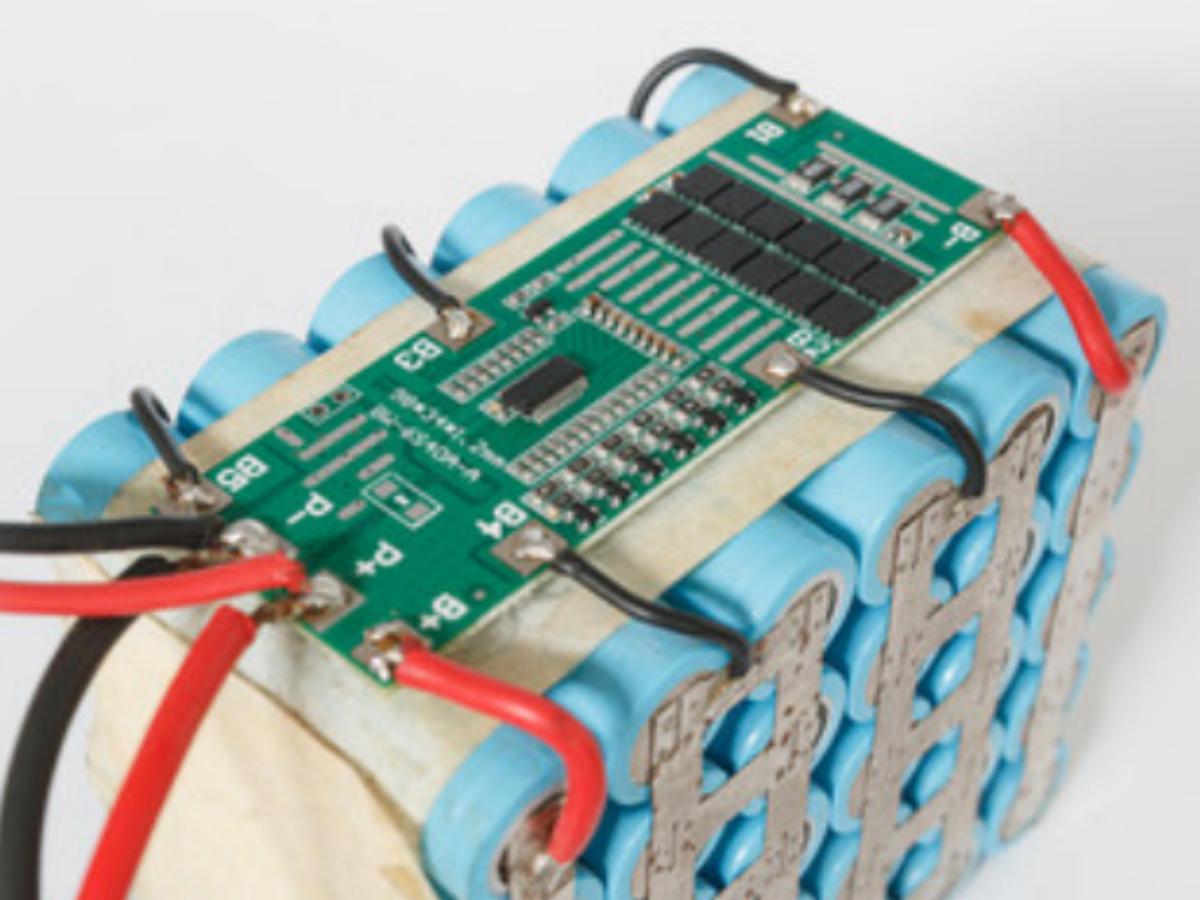
Related Products